Charts
When it comes to making trading decisions in the financial markets, understanding and analyzing data is crucial to success. Among the technical analysis tools widely used in this context are charts, which provide a comprehensive and visual view of price movement and trends in the market.
Chart types:
Charts come in a variety of forms, the most prominent of which are:
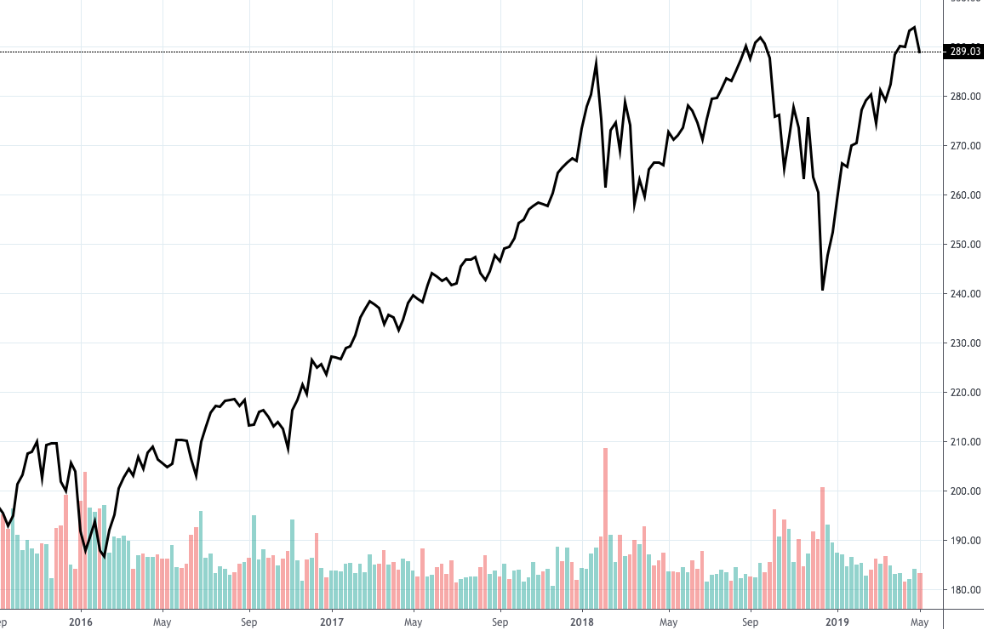
Line Charts: Display the price movement over a certain period of time with a straight line. It provides the trader with a general view of the market trend.
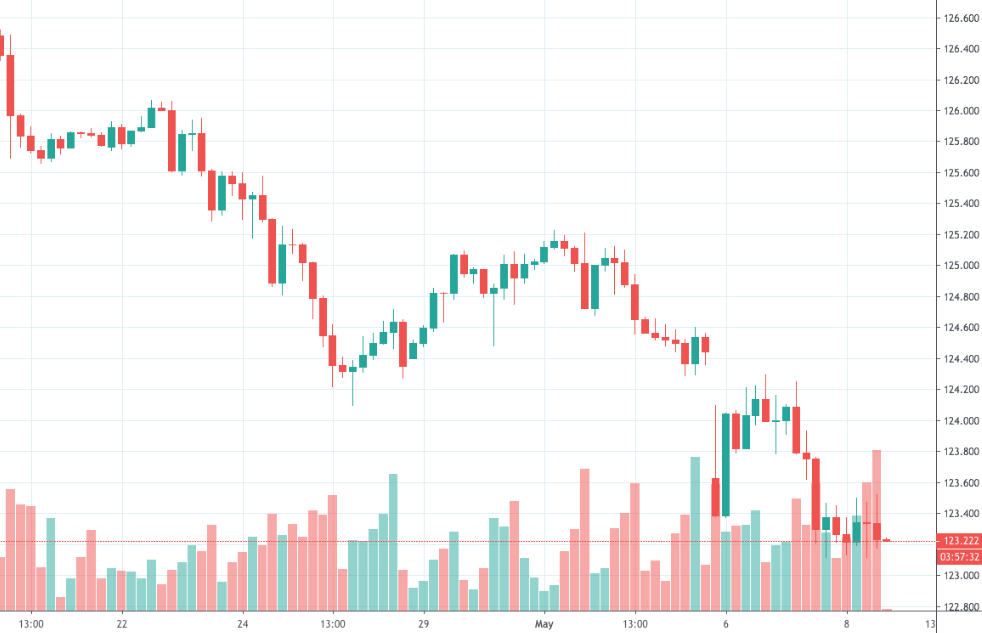
-Candlestick Charts: They rely on presenting price data in the form of candles, where each candle shows the opening and closing price and the highest and lowest price during a specific period of time.
Bar Charts: Display the same data as candlestick charts, but using vertical bars.

The importance of charts in trading:
-Trend analysis: Charts help traders identify market trends and anticipate their possible changes.
-Discovering price patterns: Charts help in discovering different price patterns such as heads, shoulders, triangles, etc., which helps in making investment decisions.
-Determining entry and exit points: Charts provide traders with information about the best opportunities to enter and exit the market based on price analysis.
-Identifying support and resistance levels: Charts provide traders with a view of support and resistance levels that can influence price movement.
Use charts effectively:
-Continuous learning: The trader must be familiar with different types of charts and how to read and interpret them.
Relying on comprehensive analysis: A trader should use charts as part of a comprehensive trading strategy that includes other analytical tools such as indicators and moving averages.
Strategy testing: The trader must test his strategy based on chart analysis on historical data before applying it to real markets.
Charts are a vital tool in trading operations in financial markets, as they provide traders with a comprehensive view of price movement and help them make the right investment decisions. By using charts effectively and balanced, traders can achieve success and achieve their goals in trading in the financial markets.